The Effect of
Climate Change On The Arizona Quadrat
Posted on August 15, 2013 by Willis Eschenbach
Anthony recently pointed
out a new paper called “Dramatic Response of Montane Plants to Climate
Change in the Southwest” by Brusca et al., available
here.
In that paper, the authors have done an
interesting repeat of an earlier study.
In the Brusca2013
study the authors report having done a new plant count following the uphill
route along the same road used in a study done by Whittaker and Neiring in 1963 (W&N63). The
road runs from Tucson to the top of Mt. Lemmon. They claim that their results
show that warmer, drier weather is forcing Arizona plants uphill.
Could this be happening? Sure, it’s
possible. Have the authors of Brusca2013 shown it to
be a) actually happening and b) the result of climate change? Good questions.
Here’s their summary of the results:
 ORIGINAL
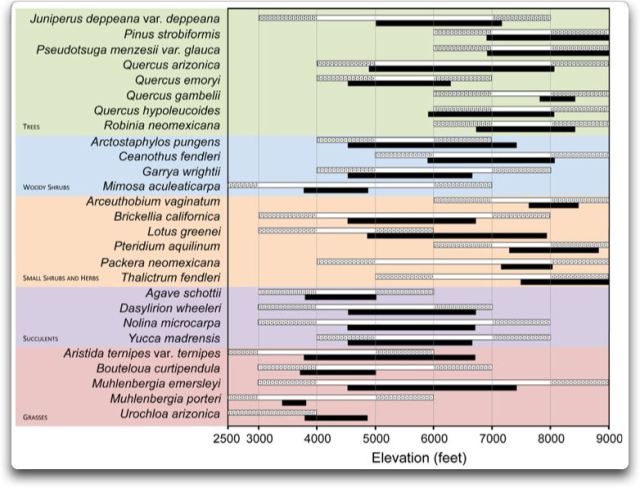
CAPTION, BRUSCA2013 STUDY: Figure 1. Summary of elevation range of the 27 most common upland montane
plants along the Catalina Highway. White bars are 1963 elevational range data from Whittaker and Niering (1964), the two terminal (stippled) 1000-ft bands denoting Whittaker’s upper- and lowermost 1000-ft vegetation bands. Black bars represent 2011 elevation
data from this study. To be as conservative as possible, a change in a species
elevation limit (high or low) was noted only if that species was found outside
(above or below) the upper- or lowermost 1000-ft
band. Thus, if anything, we underestimate the elevational
change in the species since 1963 (see Materials and Methods). Following this
protocol, 15 species show an unambiguous increase in lower elevation, four show an increase in upper elevation, and eight show a
decrease in upper elevation.
ORIGINAL
CAPTION, BRUSCA2013 STUDY: Figure 1. Summary of elevation range of the 27 most common upland montane
plants along the Catalina Highway. White bars are 1963 elevational range data from Whittaker and Niering (1964), the two terminal (stippled) 1000-ft bands denoting Whittaker’s upper- and lowermost 1000-ft vegetation bands. Black bars represent 2011 elevation
data from this study. To be as conservative as possible, a change in a species
elevation limit (high or low) was noted only if that species was found outside
(above or below) the upper- or lowermost 1000-ft
band. Thus, if anything, we underestimate the elevational
change in the species since 1963 (see Materials and Methods). Following this
protocol, 15 species show an unambiguous increase in lower elevation, four show an increase in upper elevation, and eight show a
decrease in upper elevation.
Note that in the original W&N63 study, they only recorded the elevational
band (e.g 3,000-4,000 feet) of the lowest and highest
specimens. They did not record the actual elevation (e.g
3,232 ft) of the specimens at the extremes. This has
created some difficulties in the Brusca2013 authors’
interpretation of their results. For example, look at the grass “Muhlenbergia porteri” (second
line from the bottom). It is counted as one of the fifteen species whose lower
elevation has been raised. The problem is, the lowest elevation looked at in
the new study is 3,500 feet, viz:
Thus, our plant quadrat sampling began at
3500 ft/1067 m and ended at 9111 ft/
2777 m, excluding desertscrub at the base of the
mountains.
Since the new study only began at 3,500
feet, we cannot say that the lower range of this species is increased.
They have incorrectly counted it as having an “unambiguous increase in lower
elevation”. Does this one error invalidate the study? No. But this kind of
error, in favor of their conclusion, does make a person wonder if the authors
might have a solution (climate change) and be looking to fit evidence to that
solution.
And what makes me wonder even more is that
there are three other records with the same problem …
The difficulty is in their analysis of
their own data. They want to compare their results to W&N63,
which is a good thing, they should do so. But we need to have an apples to apples comparison. To do that, the very first
thing you have to do is to convert their data to the “elevational
bands” intervals used by W&N63. Yes, you need
to throw away information to do it, but if you want to compare the two studies,
you have to do it. For an example of what this does, look at
Agave schottii, the first succulent in the purple
band. It looks like the elevational range has
shrunk considerably. But if the proper method were used, counting only by elevational bands as in W&N63,
we’d see that there is absolutely no difference between the two records. W&N found it in three bands, and so did the latest
study. Now, to their credit, they count it as unchanged. But it is incorrect to
present their data for comparison with W&N63 in absolute
elevations, rather than elevational bands as in the
original study. To compare apples to apples, they have to first convert their
data to elevational bands. Their failure to do so has lead them to false conclusions.
With that in mind, look at the bottom row,
the grass “Urochloa arizonica”.
When we convert their data to the W&N63 elevational bands, we see that there is no evidence of an
upward trend at the bottom end, because the new survey only started at 3,500
feet. In terms of elevational bands, all we know from
the new data is that that grass is still found between 3,000 and 4,000 feet,
just as in the original W&N63 survey. For all we
know, the current authors may have found the exact same patch that W&N found in 1963. As a result, we have no new
information establishing the bottom end of its range.
The same is true for the woody shrub Mimosa
aculeaticarpa, and the grass Aristida
ternipes. Once we are comparing apples to apples by
converting the data to elevational bands, it’s
obvious we know nothing new about the lowest elevations at which they can be
found. In all cases, they used to be found between three and four thousand
feet, they still are, and we have no new information below 3,500 feet. From
that we cannot conclude anything at all about changes in their lower
boundaries.
This means that the authors have improperly
identified no less than four of the records as showing an increase in lower
elevations when the data does not support that claim.
Once that error is corrected, this leaves
us with a curious result:
• 11 species have increases in lower
elevation. Their range has shrunk from the bottom.
• 8 species have decreases in upper
elevation. Their range has shrunk from the top.
• 4 species have increases in upper
elevation. Their range has increased at the top.
I would hardly call that a convincing case
for much of anything … however, they say it is a consequence of “climate
change”, which they are defining as follows
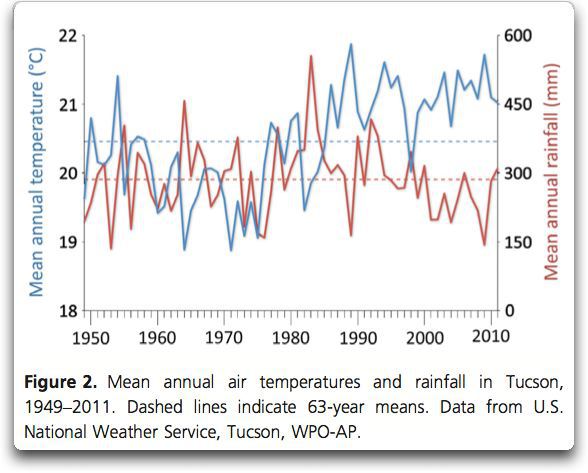
Since the previous survey in 1963, the
rainfall has gone up and then back down, not much change there. Arizona is
always dry. However, as they point out, the temperature definitely has gone up
… in Tucson, down on the valley floor far below the mile-high plants being
studied. Measured at an airport which, unlike in 1963, is now half-surrounded
by the city. So that might reflect changes up in the mountains … or not, we
don’t know.
In addition, with changes in eleven lower
and eight upper altitudinal limits in opposite directions, we can’t say the
plants are moving up the mountain as they claim. Statistically, those two are
no different.
And how is that collection of contradictory
results supposed to happen from climate? Are we really to believe that the climate
has driven the grass ”Muhlenbergia
porteri” (second line from the bottom) from 6,000
down to 3,000 feet, and if so, how does that work?
Finally, we have to consider confounding
factors, which unfortunately they have ignored. The biggest one of these is the
huge interaction between the plants and the animals in any ecosystem. For
example, for the first time in decades the bears in Yellowstone Park are
feasting on berries as they store fat for the winter. Is the increase in the
number of berries a result of climate change modifying the berries’ elevational limits?
In a word … no. Curiously, it’s because
of the return of the wolves to Yellowstone Park. The berries have been getting
grazed to the bone by the elk for decades, but now that the wolves are keeping
the elk in check, the berries are coming back, and the bear are getting their
chance.
And although there are no elk in the area
of this study, this is
Arizona
Game Management Unit 33 (http://www.azgfd.gov/h_f/hunting_units_33.shtml), and the list says “Species within this unit: Javelina, Mule Deer, White-tailed Deer, Cottontail Rabbit,
Dove, Tree Squirrel, Quail”. Pigs, rabbits, mule and white-tail deer …
how have their numbers changed over time, and what effect has
this had on the local plant species? Where I live, the deer exert a huge
control over the shape and nature of the biome. And pigs are noted for their
effect on the local plant ecology. What’s happening with the pig population?
SUMMARY
• The study has significantly over-counted
the number of species whose lower limits have increased. The
number of species whose lower limits increased drops from their claim of over
half (56%) of the species studied, down to 41% of the species.
• Over a quarter of the species studied had
upper limits that moved down the mountains, not up as might be predicted.
• The study used temperature data which is
from the valley floor, which has a good chance of being contaminated to an
unknown degree by urban heating effects.
• The study failed to consider changes in
local animal populations as an alternate explanation for at least some of the
plant changes.
• Some species showed huge changes in their
range, beyond what a few degrees in average temperature might reasonably
explain. This indicates that other factors are likely at play.
• There was no discussion of natural
fluctuations in the ranges of the plants. Plants are subject to a host of
ever-changing forces. Is the current variation in range outside their normal
variation, whatever that may be?
Overall, while it is an interesting study
and I commend them on repeating the earlier transect, I’d say they have totally
failed to demonstrate that the plants are responding in any meaningful or
predictable way to the vagaries of the local climate …
Source:
http://wattsupwiththat.com/2013/08/15/the-effect-of-climate-change-on-the-arizona-quadrat/
 ORIGINAL
CAPTION, BRUSCA2013 STUDY: Figure 1. Summary of elevation range of the 27 most common upland montane
plants along the Catalina Highway. White bars are 1963 elevational range data from Whittaker and Niering (1964), the two terminal (stippled) 1000-ft bands denoting Whittaker’s upper- and lowermost 1000-ft vegetation bands. Black bars represent 2011 elevation
data from this study. To be as conservative as possible, a change in a species
elevation limit (high or low) was noted only if that species was found outside
(above or below) the upper- or lowermost 1000-ft
band. Thus, if anything, we underestimate the elevational
change in the species since 1963 (see Materials and Methods). Following this
protocol, 15 species show an unambiguous increase in lower elevation, four show an increase in upper elevation, and eight show a
decrease in upper elevation.
ORIGINAL
CAPTION, BRUSCA2013 STUDY: Figure 1. Summary of elevation range of the 27 most common upland montane
plants along the Catalina Highway. White bars are 1963 elevational range data from Whittaker and Niering (1964), the two terminal (stippled) 1000-ft bands denoting Whittaker’s upper- and lowermost 1000-ft vegetation bands. Black bars represent 2011 elevation
data from this study. To be as conservative as possible, a change in a species
elevation limit (high or low) was noted only if that species was found outside
(above or below) the upper- or lowermost 1000-ft
band. Thus, if anything, we underestimate the elevational
change in the species since 1963 (see Materials and Methods). Following this
protocol, 15 species show an unambiguous increase in lower elevation, four show an increase in upper elevation, and eight show a
decrease in upper elevation.